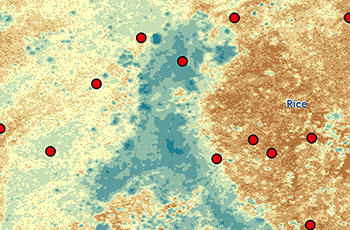
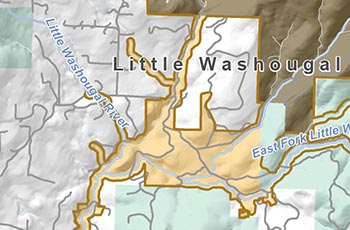
We specialize in designing eye-catching maps that attract attention and help you convey your message. From wall-sized posters to thumbnails for your website, we can help you make maps that inform, persuade, organize, explain, or entertain.
Sometimes you need data as well as maps. We can help you determine where your watershed was logged over the past forty years, where flooding most frequently occurs, or the conservation status of wetlands within your project area.
Where is the best remaining habitat for your species of interest? Which properties should you purchase to efficiently meet your conservation goals? Which neighborhoods are most in need of new parks? We use spatial data to help you answer complex questions such as these.
Whether you need a simple map to show the location of your current conservation activities or a more sophisticated queryable layer-switching app, we can get your spatial data on the web.
Matt specializes in cartography, spatial analysis, web mapping, conservation planning, and GIS project management. He works primarily with government agencies and non-profits focused on conservation and restoration. Matt has twenty years of experience using GIS to convey complex spatial information with striking cartography and eye-catching graphics. He holds a B.S. in Public Planning from Northern Arizona University and a Masters in Urban Planning from the University of Washington.
View PortfolioThe Nature Conservancy
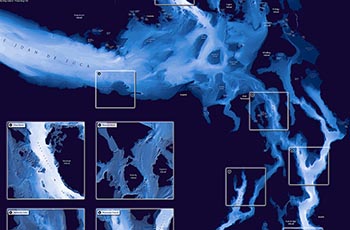
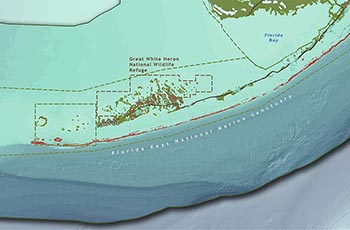
The Nature Conservancy recently completed a two-year project to produce biodiversity data in support of marine spatial planning in Washington. This seafloor mapping project fills a critical data gap in the region by creating bathymetry, substrate, and geomorphology data below 20 meters depth for all of Puget Sound and the Strait of Juan de Fuca.
CORE GIS worked with TNC to produce four large-format maps to showcase the data and promote it throughout the marine research and conservation communities.
Raise Your Hand Texas
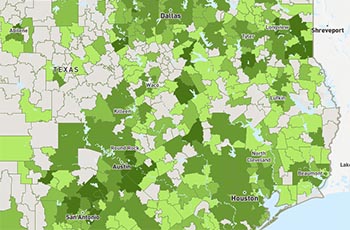
Raise Your Hand Texas is a non-profit educational advocacy group based in Austin, Texas. We worked with RYHT to produce an interactive web map showing the potential changes to school funding under District Partnership Agreements, which enable a school district to be funded similarly to a charter school. This could result in substantially more money for schools, up to $2,300 per student.
We built this map using a custom Mapbox style and the Mapbox GL JS API. The map features a zoom-to-district functionality (in the fly-out on the left hand side), information about each district will appear in a pop-up when a district is clicked, and zooming into the map will reveal individual campuses. Hovering over the campus location will reveal the name of the school.
Sierra Club
Climate change is the greatest threat our natural environment has ever faced. The Sierra Club's Resilient Habitats Campaign is actively working to create resilient habitats where plants, animals, and people are able to survive and thrive on a warmer planet.
CORE GIS worked with the Sierra Club to develop poster-sized maps showcasing the efforts to create resilient habitats in the Alaskan Arctic, California Coast, Greater Everglades, Gulf Coast, Adirondacks to Acadia, Quetico-Superior, Washington, and an overview map showing all 10 regions.
Sightline Institute
The Sightline Institute is a non-profit Seattle think tank focused on sustainability, environmental justice, and good governance. As part of their focus on housing and the changing nature of Seattle's neighborhoods, they asked us to work with them to map every housing sale in the City of Seattle in the 12 month period starting July 1st, 2016.
We built this map using the Carto Builder and Google Street View API with publically available data from the King County Assessor. The map opens at the full extent of the City of Seattle, showing average home sales prices for single family and multi-family homes by neighborhood. Zooming in to the map reveals every individual sale by single family and multi-family. Clicking on an individual sale will reveal a photo of the property, the sale price, and additional information. A widget on the right hand side shows the number of homes within each category by year built.
King County Parks
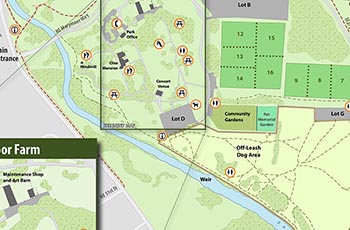
Marymoor Park is a large regional park located on the north end of Lake Sammamish. It hosts a wide variety of activities, including soccer, baseball, birding, and concerts, and also contains a velodrome, off-leash dog area, p-patches, a remote controlled airplane field, and the historic Willowmoor Farm.
CORE GIS worked with King Coutny parks and the Friends of Marymoor Park to produce a two-sided map illustrating the location of all of these activities. A folded, tabloid sized map is distributed to visitors at the entrance to the park, and a very large version of the map is posted at the two entrances to help park users find their way.
Forest Park Forever
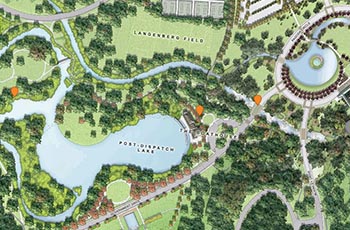
Forest Park Forever is a private nonprofit conservancy that works in partnership with the City of St. Louis and the Department of Parks, Recreation and Forestry to restore, maintain and sustain Forest Park as one of America’s greatest urban public parks. We worked with Forest Park Forever to map their 2017 park projects.
We built this map using a custom Mapbox style and Mapbox JS API. The map features a geo-referenced architectural rendering of the park and markers that generate a custom pop-up featuring a photo of the project and additional information about the work completed at each site.
The Trust for Public Land
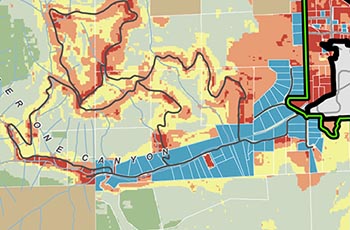
Working with the Trust for Public Land, the Chelan-Douglas Land Trust, City of Wenatchee, and Chelan County, CORE GIS provided mapping, analysis, and planning support for a conservation effort focused on the Cascade foothills to the west of the City of Wenatchee. We analyzed and mapped development potential, development probability, viewsheds, and infrastructure for all privately owned parcels within the study area, and worked with Washington Department of Fish and Wildlife biologists to model predicted Mule deer winter range. Additionally, we mapped other critical wildlife habitats, existing and potential trails, trailheads and other recreational facilities. CORE GIS also provided layout and graphic design for the final report, which can be downloaded below.
Judy Bentley
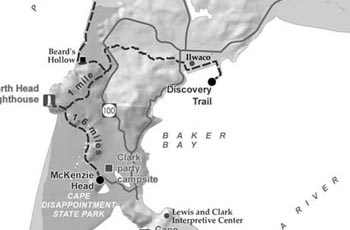
CORE GIS worked with author Judy Bentley to produce 50 maps showing trails, historic sites, and other landmarks that tell the history of Washington State. From the book description: "Hiking Washington's History reveals the stories embedded in Washington's landscape. This trail guide narrates forty historic trails, ranging from short day hikes to three or four-day backpacking trips over mountain passes. Every region in the state is included, from the northwesternmost tip of the continental United States at Cape Flattery to the remote Blue Mountains in the southeast. Each chapter begins with a brief overview of the region's history followed by individual trail narratives and historical highlights."
Stillaguamish Tribe of Indians
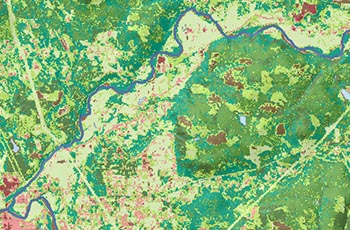
The Stillaguamish Tribe of Indians' ancestral lands are located along the banks of the Stillaguamish River in Skagit and Snohomish Counties in Washington State. CORE GIS worked with Tribal biologists and resource managers to produce a historic dataset of landcover within the North Fork Stillaguamish River watershed. We acquired black and white aerial photographs from 1954, georeferenced the photos, created a seamless photomosaic, and used the photos to produce landcover GIS data. We used Landsat TM 4/5 imagery to produce supervised classifications of landcover for 1987, 1991, 2001, 2006, and 2011. The Tribe is currently using these datasets in in conjunction with NOAA scientists to model the effects of logging on salmon productivity in the Stillaguamish River and its tributaries.
Sightline Institute
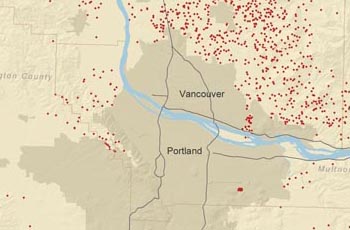
CORE GIS worked with the Sightline Institute to map rural sprawl in Metropolitan Portland, Oregon. As a single metropolis split between two states, greater Portland, Oregon, offers an intriguing natural experiment for gauging the effects of different growth management regimes. The Oregon side of the metro area operates under the nation’s oldest and most mature growth management system, established in the 1970s. The smaller but fast-growing Washington side of the metro area is governed by a newer growth management law. On paper, the two states’ growth management programs share many features; in practice, their records have diverged.
The maps we produced show that Clark County had much more exurban population growth than did neighboring Oregon counties, both between 1990 and 2000 and between 2000 and 2010. All population counts are from the US Census.
Center for Natural Lands Management
The streaked horned lark is a threatened bird species that nests on sandy islands in the channel of the Columbia River. Historically, these islands were formed and reformed by the periodic flooding of the Columbia River, which replenished the sandy habitats the lark requires for successful breeding. However, a century of damming the river and regulating its flow for navigation and flood regulation has nearly elminated the birds' habitat. A remnant population has been successfully breeding on islands where the Port of Portland and US Army Corps of Engineers deposit the spoils from their dredging to maintain a navigable channel.
Working with biologists from the Center for Natural Lands Management and the Washington Department of Fish and Wildlife, CORE GIS used image segmentation of infrared and true-color aerial imagery to produce habitat maps for 1996 and 2008. We used supervised classifications of near-infrared NAIP orthophotography to produce habitat maps and NDVI for 2011. Using these habitat maps in conjunction with field observations, we were able to determine the ideal timing and location of future dredge spoil depositions to maximize the amount of suitable lark habitat and minimize the amount of disruption to the birds during breeding season.
Clark County, Washington and the Columbia Land Trust
The Clark County Conservation Areas Acquisition Plan provides a vision for preserving and enhancing a countywide system of conservation lands, including greenways, habitat, farm and forest resource lands. The plan identifies specific project opportunities to pursue over the next six years, identifies high value conservation lands, and highlights a variety of funding mechanisms that can support project implementation.
CORE GIS collaborated with Columbia Land Trust to produce a series of maps highlighting the high-value conservation areas throughout the county that form the backbone of the Plan. We used a variety of data to identify these areas, including floodplains, salmon habitat, wetlands, priority habitats and species, and the location of existing protected lands and trail corridors.
Considering a mapping project? Not sure where to start? Give us a call, send an email, or send a tweet to get in touch. We are happy to answer your questions, spend some time brainstorming, provide additional examples, or meet in person to discuss your project and how we might be able to help.
CORE GIS